There are two methods to smooth time series data—specifically. The purpose of data smoothing algorithms is to reduce “roughness” (noise) while preserving the important large-scale trends.
Simple Moving Average (SMA)
SMA is computationally light and easy to maintain incrementally. It is theoretically optimal for recovering trends when the noise is normally distributed. Compared to complex alternatives like Fourier transforms or Savitzky-Golay filters, SMA requires fewer parameters (just the window size w) and performed better for their specific preservation metrics.
The Algorithm: Given a window size w and a sequence of data points , the smoothed value is the arithmetic mean of the sequential points starting at .
Exponential Moving Average (EMA)
The EMA is generally considered “better” and slightly faster than the Simple Moving Average (SMA). SMA treats the oldest data point in the window with equal importance to the newest one, which causes significant delay (lag) in detecting trends. EMA gives more weight to the most recent data, so it reacts faster.
SMA requires you to store the last data points (the window). EMA only requires you to store the current value and the previous average.
While SMA is efficient, EMA is mathematically simpler because it doesn’t need to manage a buffer or sum a list.
The EMA Formula:
Where (alpha) is a smoothing factor between 0 and 1.
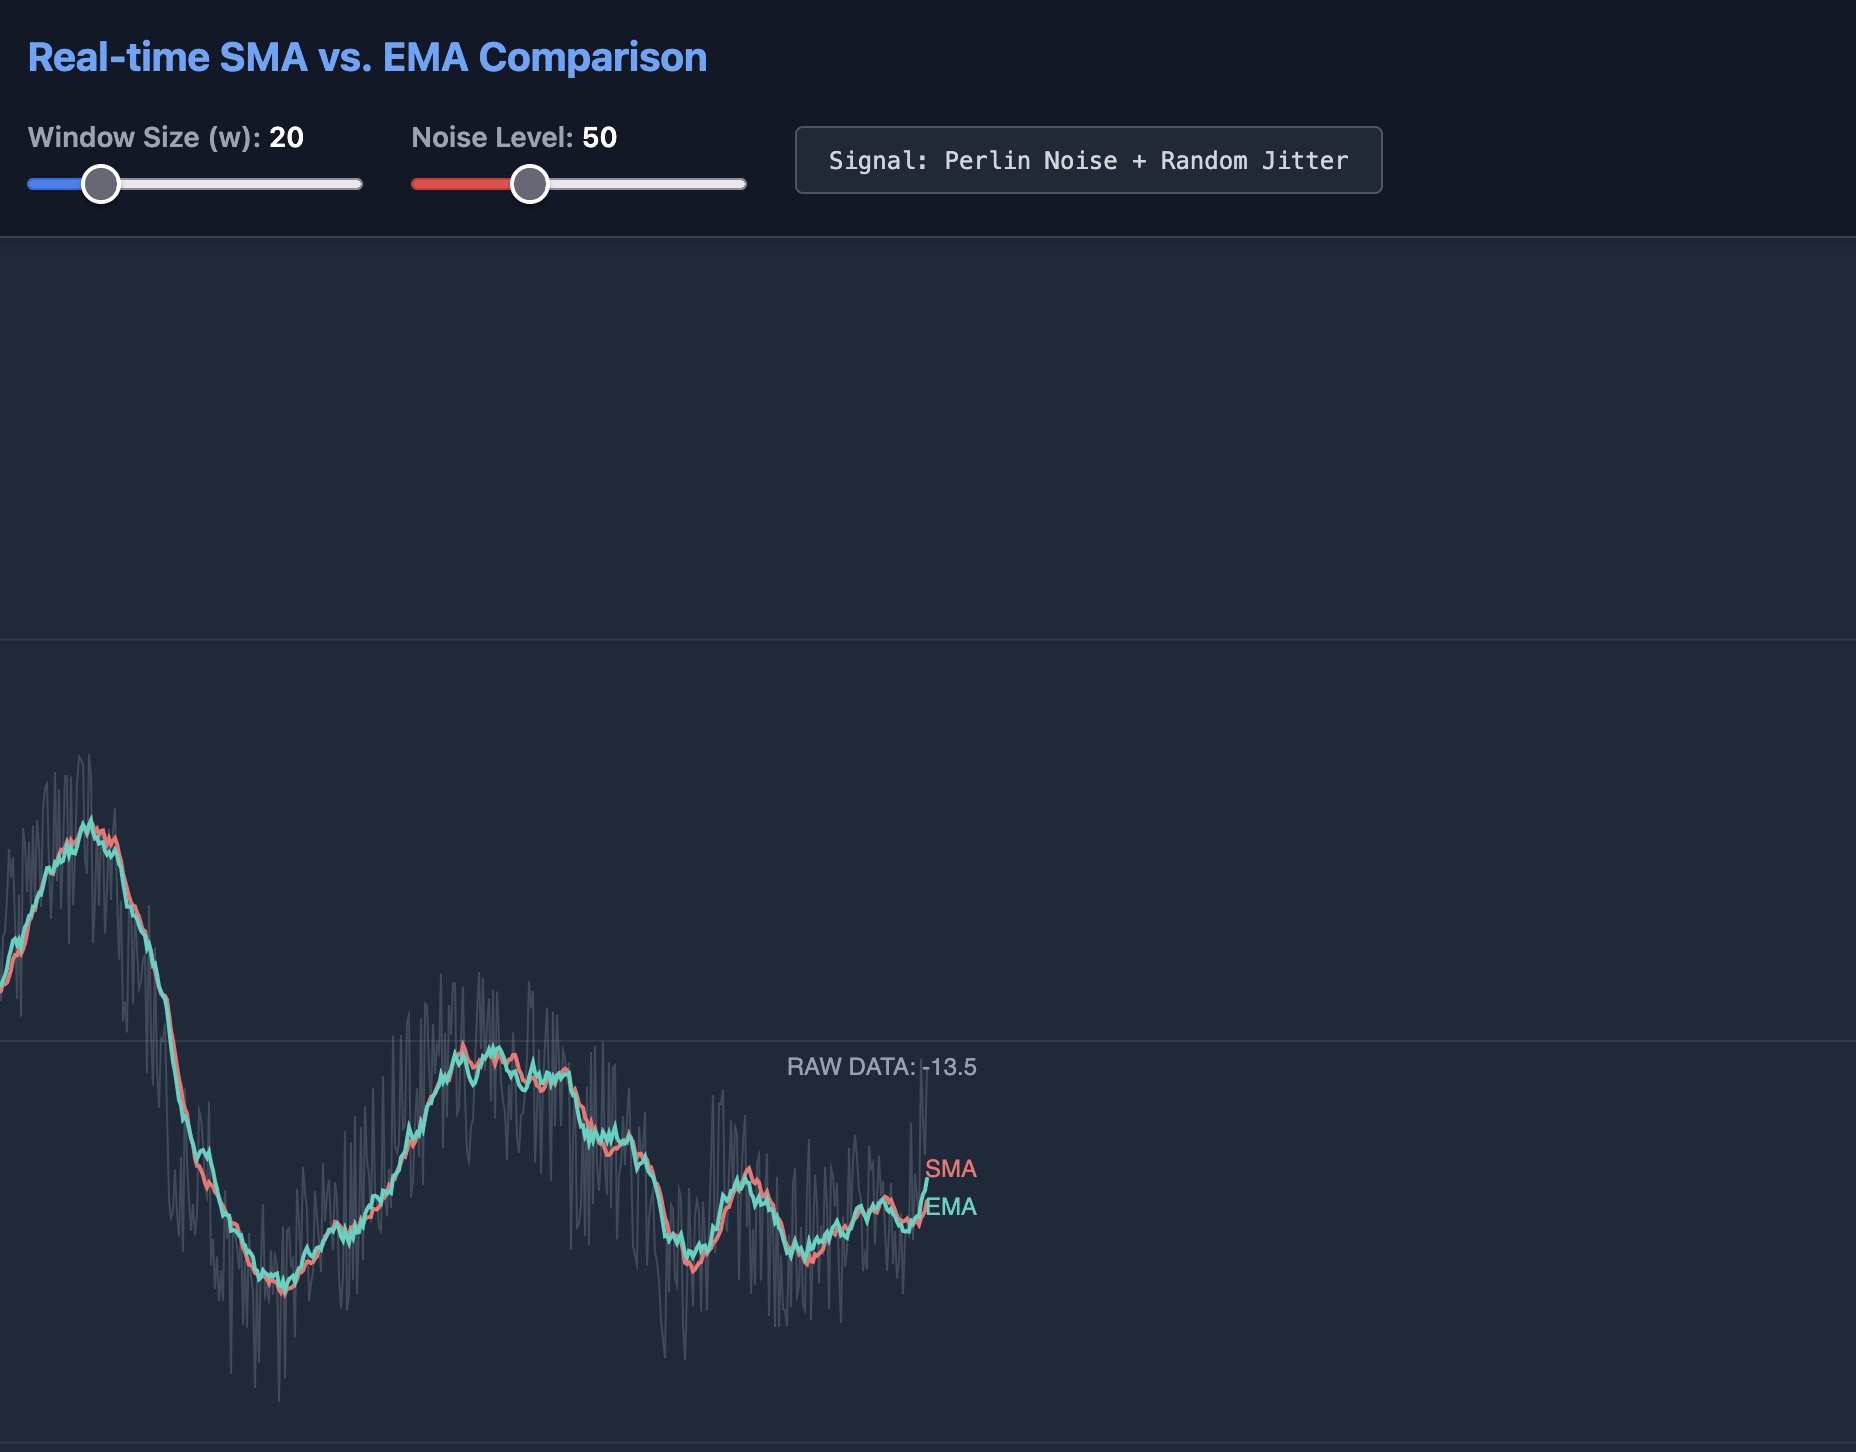
The following simulation generates pseudo-random data (a sine wave with added Gaussian noise) and applies the SMA and EMA algorithms defined above. Interactive sliders to let the user control the Window Size (w) and the Noise Level in real-time.
<!DOCTYPE html>
<html lang="en">
<head>
    <meta charset="UTF-8">
    <meta name="viewport" content="width=device-width, initial-scale=1.0">
    <title>SMA vs EMA Real-time Smoothing</title>
    <!-- Tailwind CSS for layout styling -->
    <script src="https://cdn.tailwindcss.com"></script>
    <!-- p5.js Library -->
    <script src="https://cdnjs.cloudflare.com/ajax/libs/p5.js/1.9.0/p5.min.js"></script>
    <style>
        body { margin: 0; padding: 0; overflow: hidden; background-color: #1a202c; color: #e2e8f0; }
        canvas { display: block; }
    </style>
</head>
<body class="flex flex-col h-screen">

    <!-- Header / Controls -->
    <div class="p-4 bg-gray-900 border-b border-gray-700 shadow-md z-10">
        <h1 class="text-xl font-bold mb-4 text-blue-400">Real-time SMA vs. EMA Comparison</h1>

        <div class="flex flex-wrap gap-6 items-center text-sm">
            <!-- Window Size Control -->
            <div class="flex flex-col">
                <label for="window-slider" class="font-semibold mb-1 text-gray-400">
                    Window Size (w): <span id="window-val" class="text-white">20</span>
                </label>
                <input type="range" id="window-slider" min="2" max="100" value="20" class="accent-blue-500 cursor-pointer">
            </div>

            <!-- Noise Level Control -->
            <div class="flex flex-col">
                <label for="noise-slider" class="font-semibold mb-1 text-gray-400">
                    Noise Level: <span id="noise-val" class="text-white">50</span>
                </label>
                <input type="range" id="noise-slider" min="0" max="150" value="50" class="accent-red-500 cursor-pointer">
            </div>

            <!-- Status Indicator -->
            <div class="px-4 py-2 bg-gray-800 border border-gray-600 rounded text-gray-300 font-mono text-xs">
                Signal: Perlin Noise + Random Jitter
            </div>

            <div class="text-xs text-gray-400 ml-auto max-w-md hidden lg:block">
                <div class="flex items-center gap-2 mb-1"><div class="w-3 h-3 bg-gray-500 rounded-full opacity-50"></div> Raw Data</div>
                <div class="flex items-center gap-2 mb-1"><div class="w-3 h-3 bg-red-400 rounded-full"></div> SMA (Simple) - Laggy</div>
                <div class="flex items-center gap-2"><div class="w-3 h-3 bg-teal-400 rounded-full"></div> EMA (Exponential) - Responsive</div>
            </div>
        </div>
    </div>

    <!-- Canvas Container -->
    <div id="canvas-container" class="flex-grow relative bg-gray-800"></div>

    <script>
        // --- Configuration & State ---
        let rawData = [];
        let smaData = [];
        let emaData = [];

        // UI Elements
        let windowSlider, noiseSlider, windowLabel, noiseLabel;

        // Parameters
        let windowSize = 20;
        let noiseLevel = 50;

        // EMA State
        let previousEMA = 0;
        let isFirstFrame = true;

        function setup() {
            // Create canvas filling the remaining space
            const container = document.getElementById('canvas-container');
            const canvas = createCanvas(container.offsetWidth, container.offsetHeight);
            canvas.parent('canvas-container');

            // Connect DOM elements
            windowSlider = document.getElementById('window-slider');
            noiseSlider = document.getElementById('noise-slider');
            windowLabel = document.getElementById('window-val');
            noiseLabel = document.getElementById('noise-val');

            // Listeners for sliders
            windowSlider.addEventListener('input', (e) => {
                windowSize = parseInt(e.target.value);
                windowLabel.innerText = windowSize;
            });

            noiseSlider.addEventListener('input', (e) => {
                noiseLevel = parseInt(e.target.value);
                noiseLabel.innerText = noiseLevel;
            });

            // Handle window resize
            window.addEventListener('resize', () => {
                resizeCanvas(container.offsetWidth, container.offsetHeight);
                // Reset arrays on resize to prevent rendering glitches
                rawData = [];
                smaData = [];
                emaData = [];
                isFirstFrame = true;
            });

            frameRate(30);
        }

        function draw() {
            background(30, 41, 59); // Dark slate background

            // --- 1. Real-time Data Generation & Processing ---

            // Generate underlying smooth trend using Perlin noise
            // We use frameCount to move through noise space
            let trend = (noise(frameCount * 0.01) - 0.5) * (height * 0.6);

            // Add jitter (White Noise) based on slider
            let jitter = (Math.random() - 0.5) * noiseLevel * 2;

            let currentVal = trend + jitter;

            // Add to Raw Data Buffer
            rawData.push(currentVal);

            // Calculate SMA (Average of last 'windowSize' elements)
            let smaVal = 0;
            let count = 0;
            let startIdx = Math.max(0, rawData.length - windowSize);
            for(let i = startIdx; i < rawData.length; i++) {
                smaVal += rawData[i];
                count++;
            }
            if(count > 0) smaVal /= count;
            smaData.push(smaVal);

            // Calculate EMA
            let alpha = 2 / (windowSize + 1);
            if (isFirstFrame) {
                previousEMA = currentVal;
                isFirstFrame = false;
            } else {
                // EMA formula: current * alpha + prev * (1 - alpha)
                previousEMA = (currentVal * alpha) + (previousEMA * (1 - alpha));
            }
            emaData.push(previousEMA);

            // Scroll Logic: Remove oldest data if we exceed screen width
            // We use a small buffer margin just to be safe
            if (rawData.length > width*0.5) {
                rawData.shift();
                smaData.shift();
                emaData.shift();
            }

            // --- 2. Rendering ---

            // Draw Grid Lines (Horizontal)
            stroke(255, 255, 255, 20);
            strokeWeight(1);
            line(0, height/2, width, height/2);
            line(0, height/4, width, height/4);
            line(0, height*0.75, width, height*0.75);

            // Helper to map index to X coordinate
            // We align data to the right side of the screen as it flows in
            function getX(i, arrayLength) {
                // If array is full (width), x is just i.
                // If array is filling up, we start from left.
                if (arrayLength < width) return i;
                return i;
            }

            // A. Plot Raw Data
            noFill();
            stroke(150, 160, 170, 70); // Grey, more transparent
            strokeWeight(1);
            beginShape();
            for (let i = 0; i < rawData.length; i++) {
                vertex(i, height/2 - rawData[i]);
            }
            endShape();

            // B. Plot SMA (Simple Moving Average) - RED
            stroke(248, 113, 113); // Red-400
            strokeWeight(2);
            beginShape();
            for (let i = 0; i < smaData.length; i++) {
                vertex(i, height/2 - smaData[i]);
            }
            endShape();

            // C. Plot EMA (Exponential Moving Average) - TEAL
            stroke(45, 212, 191); // Teal-400
            strokeWeight(2);
            beginShape();
            for (let i = 0; i < emaData.length; i++) {
                vertex(i, height/2 - emaData[i]);
            }
            endShape();

            // D. Labels and Current Values
            if (rawData.length > 0) {
                let lastRaw = rawData[rawData.length - 1];
                let lastSMA = smaData[smaData.length - 1];
                let lastEMA = emaData[emaData.length - 1];
                let labelX = rawData.length - 10; // slightly left of edge

                noStroke();
                textSize(12);
                textAlign(RIGHT, CENTER);

                // Raw Value Label
                fill(150, 160, 170);
                text("RAW DATA: " + lastRaw.toFixed(1), getX(rawData.length - 1, rawData.length) + 25, height/2 - lastRaw);

                // SMA Value Label
                fill(248, 113, 113);
                text("SMA", getX(smaData.length - 1, smaData.length) + 25, height/2 - lastSMA - 15);

                // EMA Value Label
                fill(45, 212, 191);
                text("EMA", getX(emaData.length - 1, emaData.length) + 25, height/2 - lastEMA + 15);
            }
        }
    </script>
</body>
</html>